
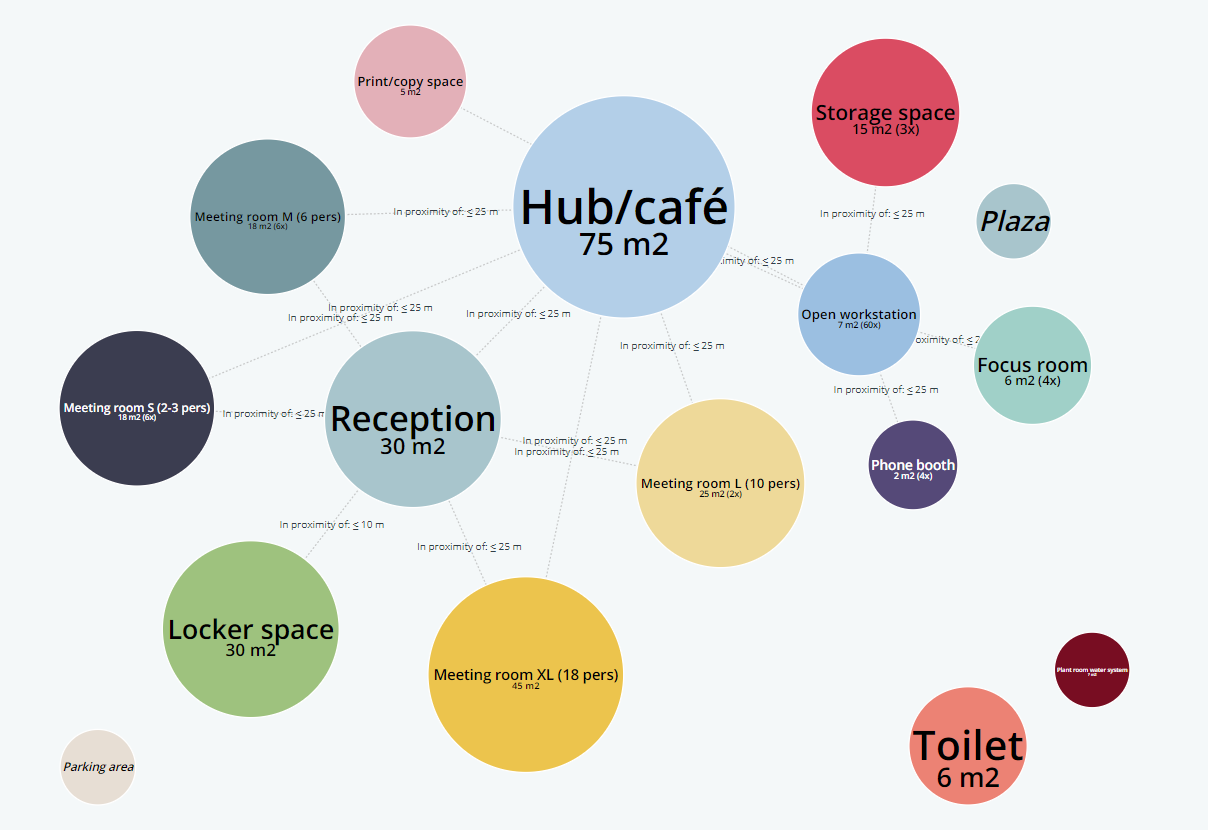
We have just released our new adjacency diagram feature. Adjacency diagrams (aka “bubble diagrams”) are a key ingredient of any architectural program. In such diagrams, spaces or functions are represented as circles (“bubbles”) and their interrelations as lines. The purpose is to give the design team a quick, visual idea of the users’ spatial requirements. Making such diagrams by hand can be quite time consuming. In BriefBuilder, they are automatically generated, based on the captured user requirements. You can select what you want to see in the diagram (e.g. urban area, the entire building, parts of it). You can zoom. You can reconfigure. And you can download the diagram as an svg file for further tweaking. Enjoy!
More info about this feature can be found in our knowledge base: https://support.briefbuilder.com/knowledge-base/adjacency-diagram/